A result that fell apart
PolicySwarm, my agent-based model of how a population's views on AI regulation move, produced this finding in an early draft. Under ordinary Euclidean distance, a longer delay before a policy is enforced made the population react more strongly to shocks: an index of about 130 against a baseline of 100. Under cosine distance the same delay made it react less, at about 75. Geometry seemed to reverse the effect of enforcement lag, and read as policy advice, that would mean whether delays make a population more fragile hinges on how the model measures disagreement.
An internal audit caught it before the draft went anywhere. The code was correct. Two choices that are easy to make without noticing produced the reversal, and three more turned up while I checked how general the problem was. Each of the five can create an effect or hide one, and a results table shows none of them unless the choice is reported. The demos below run in the browser.
Why a distance at all
In a bounded-confidence model, two agents influence each other only when their opinions are close enough (Deffuant et al., Hegselmann and Krause). With one opinion that is simple. With several opinion dimensions, "close enough" needs a distance, and the choice of distance has become a modelling question of its own.
I call a distance measure together with its update step a geometry. The gate lets two agents talk when their distance is at most a threshold ε. Under Euclidean distance the listener then moves part of the way toward the speaker in a straight line. Under cosine distance, or the plain angle between two opinions, it rotates its opinion and keeps its length. Two measures of how permissive a gate is come up throughout: its coverage, the share of opinion pairs within the threshold at one moment, and its pass rate, the share of attempted conversations that get through during a run.
Reading the right test
The draft read each geometry on its own. For each one it computed a lag index: the shock effect at a lag of 40 ticks as a percentage of the effect at no lag. Euclidean landed above 100 and cosine below it, so the draft called it a reversal.
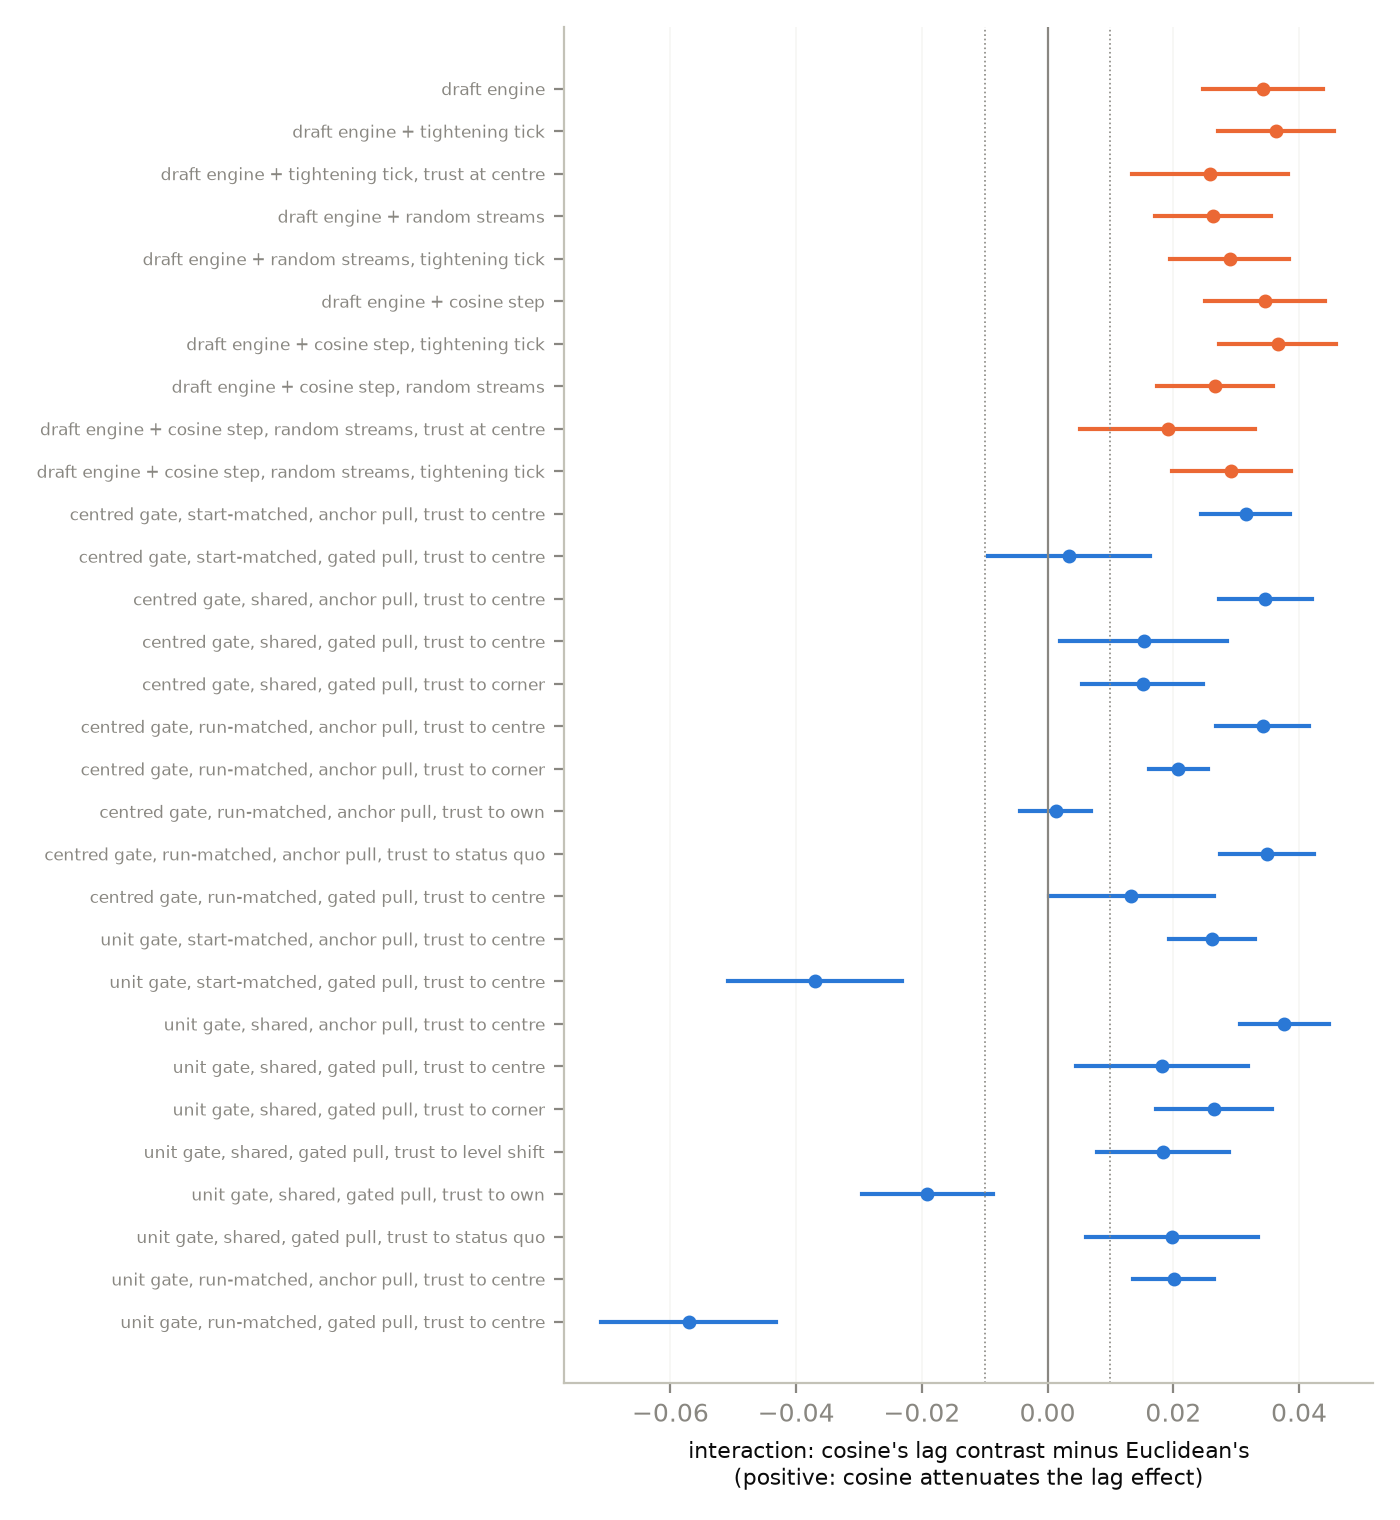
A claim that geometry changes an effect is a claim about the difference between geometries, and only a test of that difference, the interaction, checks it (Gelman and Stern). The interaction here is how much lag changes the shock effect under cosine, minus how much it changes it under Euclidean, with runs paired by seed. A positive value means lag enlarges the effect less under cosine, so that cosine attenuates the lag effect rather than reversing it.
Lag index and interaction
I reran the comparison in 30 configurations, covering the draft's own engine and the audited one with the draft's choices switched on and off. The interaction is positive in 25, negative in 3 and not significantly different from zero in 2. In the draft's own engine and settings it is +0.034 [+0.025, +0.044], the same direction as in the audited model. What looked like a reversal was cosine's index dropping below 100 (78, against 132 for Euclidean) while the comparison between the two kept its sign.
Where the origin sits
Euclidean distance does not care where the origin of the opinion space is. Angles do, because they measure direction from the origin. So does anything that shrinks a quantity toward a point. The draft coded opinions in the unit cube, which puts the origin in the corner where every dimension is at its minimum, the "regulate nothing" corner.
Moving the origin
The distance between A and B never changes, but the angle between them depends on where the origin is. Trust that shrinks toward the corner moves a distrustful agent's perceived policy much further than a trusting agent's; toward the centre the gap is small. In the paper, that difference is what moved the cosine result.
In PolicySwarm, trust does that kind of shrinking. Each agent is pulled toward the policy as it perceives it, and a low-trust agent's perceived policy is pulled toward a point I call the trust target. With trust shrinking toward the corner and angles measured from the corner, as in the draft, the audited engine gives Euclidean 116 and cosine 85, matching the draft's engine (118 and 85). Shrinking toward the centre lifts cosine to 117, and measuring the gate from the centre lifts it to 106.
A control that moves every agent's perceived policy by the same average shift takes cosine only to 103. So most of the corner's effect comes from shifting distrustful agents further than trusting ones, which an angle measured from the corner registers. Through all of this the interaction stays positive (+0.026, +0.018, +0.018). The origin moved cosine's index across 100 and left the sign of the comparison alone.
The trust target is an assumption
Trust has to shrink the perceived policy toward something, and nobody has measured what. I tried four defensible targets and they give different answers.
| trust target | Euclidean index | cosine index | effect lag 0 / 40, E | effect lag 0 / 40, C | interaction [95% CI] |
|---|---|---|---|---|---|
| centre | 146 [138, 154] | 134 [129, 139] | −0.119 / −0.174 | −0.060 / −0.080 | +0.034 [+0.027, +0.042] |
| corner | 121 [116, 125] | 106 [103, 109] | −0.121 / −0.146 | −0.071 / −0.075 | +0.021 [+0.016, +0.025] |
| own | 113 [109, 116] | 128 [125, 132] | −0.182 / −0.205 | −0.077 / −0.099 | +0.001 [−0.004, +0.007]= |
| status quo | 147 [138, 156] | 134 [129, 140] | −0.119 / −0.174 | −0.059 / −0.080 | +0.035 [+0.027, +0.042] |
The status quo behaves like the centre, as it must when starting opinions are uniform. Shrinking toward the corner leaves lag little effect under cosine (106). Shrinking toward the agent's own opinion makes the interaction equivalent to zero (+0.001), and in the draft's setting the same target makes it negative (−0.019). Euclidean's lag index alone runs from 113 to 147 across the four. The right target depends on how distrust distorts a policy signal, which the model cannot decide, so a study that uses such a model should state the target and vary it.
In the recommended design, with trust shrinking toward the centre, lag enlarges the shock effect under both geometries and less under cosine (indices 146 and 134, interaction +0.034 [+0.027, +0.042]). I would report that result, with the condition the target sweep attaches to it.
One threshold for every geometry
The other three choices are easier to see in a stripped-down model: a minimal Deffuant model with 500 agents, run for 2,000 rounds, under Euclidean, cosine and angular gates (details in Models and methods).
The simplest approach gives every geometry the same threshold number. One shared number admits very different shares of pairs. In the unit cube at ε = 0.5, a cosine gate admits 94% of pairs in four dimensions, and a Euclidean gate 14%. A comparison run that way mostly measures how often agents talk.
Coverage at a shared threshold
The bars give each gate's share of 6,000 uniformly drawn pairs at the same ε. The panels draw 70 of those pairs on the first two of the d dimensions and light the ones each gate admits. At the defaults (unit cube, ε = 0.5, d = 4) the shares match Table 2 within sampling error.
With more dimensions the gap widens, because distances concentrate as the dimension rises (Aggarwal et al.):
Proposition 1 (coverage at a fixed threshold). For independent uniform opinions, as d → ∞, ‖xi − xj‖ / √d converges to 1/√6 in [0,1]d and to √(2/3) in [−1,1]d; cos θij converges to 3/4 in [0,1]d and to 0 in [−1,1]d. Hence at a fixed threshold, cosine and angular coverage tend to 0 or 1 according to which side of these limits the threshold falls, and Euclidean coverage tends to 0 unless the threshold grows like √d.
Each limit follows from the law of large numbers. In the minimal model, a shared threshold leaves the pass rate apart by a median of 0.258 of attempted conversations under cosine, and it is equivalent to Euclidean's in no cell.
When to match
The obvious fix gives each geometry the threshold that admits the same share of pairs at the start of the run. Coverage then drifts as opinions converge, and faster under Euclidean distance than under the angular geometries, whose steps rotate an opinion without shortening it. Start-matched gates end with pass rates apart by a median of 0.162.
Pass rates after start-matching
An illustration, smaller than the paper's runs: 150 agents in the centred square, 2 dimensions, random pairs and μ = 0.3. Both runs start from the same opinions, and start-matched thresholds let each gate admit 15% of pairs at round 0. As opinions move, the share of conversations that pass drifts apart.
Matching the pass rate over the whole run does equalise it, in 16 of 18 cells. It does not equalise the number of opinion groups the run ends with: those match in only 5 of 18. At equal pass rates the geometries' response curves do not coincide, so the gap depends on where on the curves you compare them.
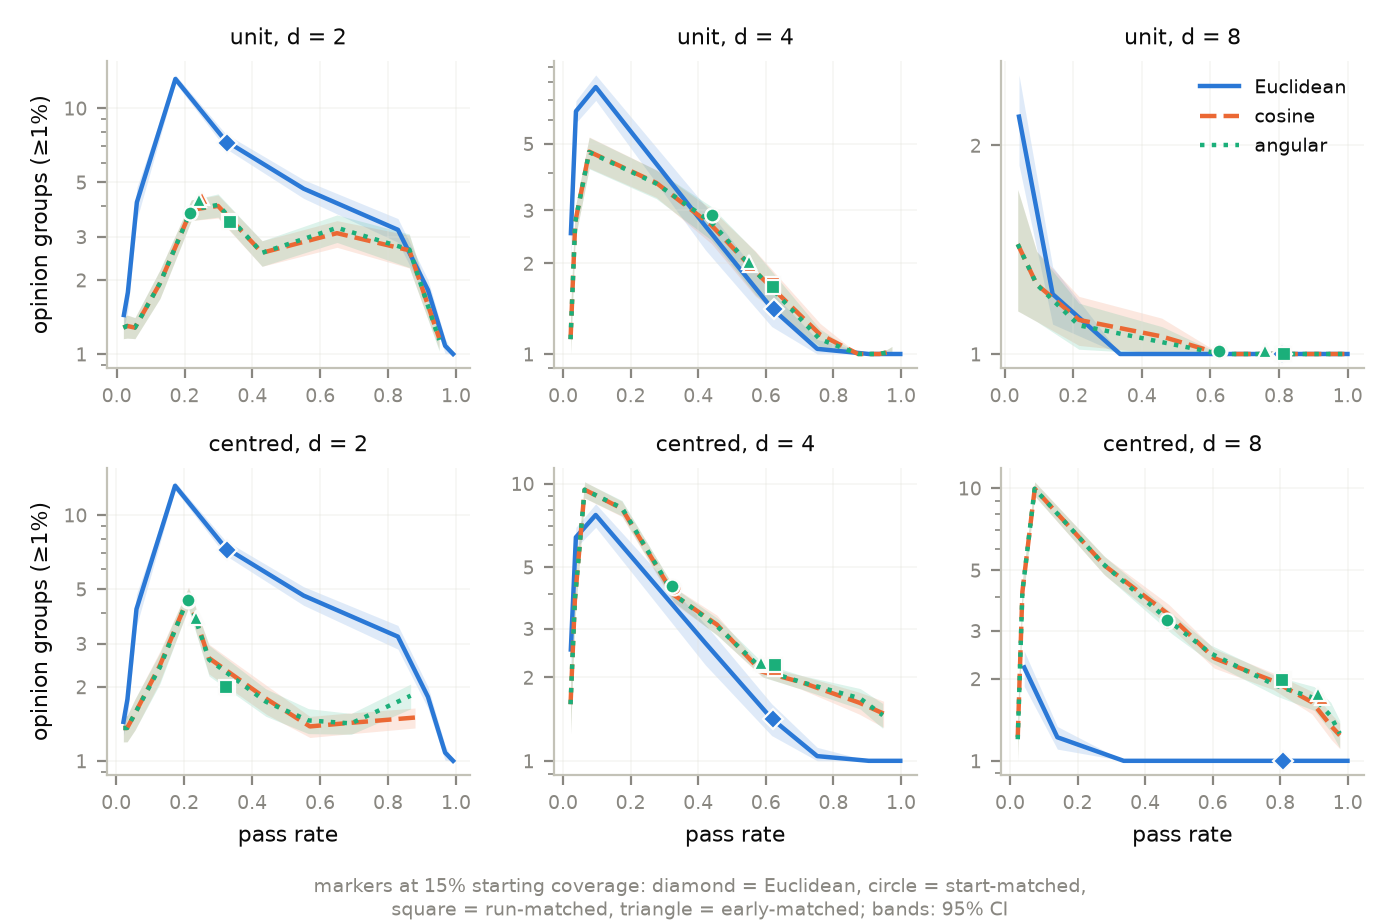
Matching therefore chooses the question. A start-matched comparison includes a geometry's effect on how often agents interact, and a run-matched one removes it. A study should say which one it answers. My own first draft claimed run-matching removed the gap, because it counted an outcome that the pass rate nearly fixes once groups have formed.
One gap does survive run-matching: the angular geometries leave final opinions more spread out. Crossing the gate with the update step shows where that comes from. A Euclidean gate with the cosine step produces most of the spread (+1.09, against +1.44 for the pure cosine pairing), while a cosine gate with the Euclidean step produces much less (+0.43). The spread is mostly the update step's doing, and a comparison that swaps the gate and the step together cannot tell the two apart.
How groups are counted
My first draft counted opinion groups within a fraction of each run's own ε. Start-matched cosine and angular gates admit exactly the same pairs, since one distance is a strictly increasing function of the other. Yet under that rule their group counts agreed in only 10 of 18 cells, and with one common ruler they agree in all 18.
Counting groups with two rulers
An illustration: 120 agents on a circle of directions. The cosine gate at ε = 0.06 and the angular gate at arccos(1 − 0.06) admit the same pairs and use the same step, so the two runs end with identical opinions. Counting within half of each run's own ε gives two different radii, and the counts can differ. One common radius gives the same count for both. We chose a starting draw where the own-radius counts differ.
The stopping time needs reporting too. After 500 rounds, 44% of Euclidean runs are still changing, and after 4,000, 13% are. The group gaps barely move over that range (0.93 to 0.87 for start-matched gates), so the remaining difference is not a transient. Only reporting the stopping time and checking a longer run shows that.
Why it matters
For anyone comparing distance measures, each of the five choices can produce or remove a difference on its own. In my two models a shared threshold moved the pass rate by a median of 0.177 to 0.258 of attempted conversations, a geometry-specific ruler left two identical gates agreeing in only 10 of 18 cells, and a test read against a benchmark turned an attenuation into a reported reversal.
For models used to inform policy, the problem is more direct. Whether enforcement delays make a population more or less fragile after shocks depended on the test read, on where the opinion space put its origin, and on a trust target that nobody had measured. A policy model is useful only when its assumptions are visible (Gilbert et al.), and any trust or credibility parameter that shrinks or scales a signal carries an origin with it. The same problems apply to any comparison of model variants that share a free parameter on different scales, which is the old docking problem (Axtell et al., Wilensky and Rand) in a narrower form.
A checklist
Before reporting that a distance measure changes a result
- Test the comparison. A claim that a geometry changes an effect is an interaction, so test it directly, and support "no difference" with an equivalence test (Lakens).
- Audit the origin. Shift and rescale the opinion space and rerun a few seeds. Anything that changes depends on the origin. Treat every shrinkage or decay target as an explicit, varied assumption.
- Do not rely on a shared threshold value. If you use one, show that the pass rates match.
- Report the response to ε, not one matched point. Start-, early- and run-matched points answer different questions, so name the one you report.
- Check for monotone equivalence. Distance measures related by a strictly increasing function are one gate once matched.
- Report the ruler and the stopping time. Count groups with one rule for every geometry, and say how many runs have not settled.
Applying the list costs a fraction of the comparison itself: a few reruns or a recount of saved states, about ten thresholds per geometry for the response curves, and one bisection per cell for run-matching.
Limitations
I have not measured how often published comparisons make these choices, so these results show that the problem can occur, not how often it does. Opinions start uniform and independent, the minimal model uses pairwise Deffuant updates only, and I did not vary μ, the population size or the network. Runs stop at 4,000 rounds, when 14% have not settled. The case study rests on one model with its own trust mechanism, though the general point, that multiplicative steps inherit the meaning of the origin, does not. Every number on this page is rebuilt by one script from the saved results.
References
- Addala, K. (2026). PolicySwarm: an agent-based model of opinion dynamics under AI governance (Version 1.2.0) [Software].
- Aggarwal, C. C., Hinneburg, A., & Keim, D. A. (2001). On the surprising behavior of distance metrics in high dimensional space. Database Theory – ICDT 2001. https://doi.org/10.1007/3-540-44503-X_27
- Axtell, R., Axelrod, R., Epstein, J. M., & Cohen, M. D. (1996). Aligning simulation models: a case study and results. Computational and Mathematical Organization Theory, 1(2), 123–141. https://doi.org/10.1007/BF01299065
- Deffuant, G., Neau, D., Amblard, F., & Weisbuch, G. (2000). Mixing beliefs among interacting agents. Advances in Complex Systems, 3(01n04), 87–98.
- Flache, A., Mäs, M., Feliciani, T., Chattoe-Brown, E., Deffuant, G., Huet, S., & Lorenz, J. (2017). Models of social influence: towards the next frontiers. Journal of Artificial Societies and Social Simulation, 20(4), 2. https://doi.org/10.18564/jasss.3521
- Gelman, A., & Stern, H. (2006). The difference between "significant" and "not significant" is not itself statistically significant. The American Statistician, 60(4), 328–331.
- Gilbert, N., Ahrweiler, P., Barbrook-Johnson, P., Narasimhan, K. P., & Wilkinson, H. (2018). Computational modelling of public policy: reflections on practice. Journal of Artificial Societies and Social Simulation, 21(1), 14. https://doi.org/10.18564/jasss.3669
- Hegselmann, R., & Krause, U. (2002). Opinion dynamics and bounded confidence: models, analysis and simulation. Journal of Artificial Societies and Social Simulation, 5(3), 2. https://www.jasss.org/5/3/2.html
- Lakens, D. (2017). Equivalence tests: a practical primer for t tests, correlations, and meta-analyses. Social Psychological and Personality Science, 8(4), 355–362. https://doi.org/10.1177/1948550617697177
- Li, G. J., Luo, J., & Chu, W. (2026). Bounded-confidence models of multidimensional opinions with topic-weighted discordance. SIAM Journal on Applied Dynamical Systems. https://doi.org/10.1137/25M1730818
- Lorenz, J. (2008). Fostering consensus in multidimensional continuous opinion dynamics under bounded confidence. In D. Helbing (Ed.), Managing Complexity: Insights, Concepts, Applications (pp. 321–334). Springer.
- Wilensky, U., & Rand, W. (2007). Making models match: replicating an agent-based model. Journal of Artificial Societies and Social Simulation, 10(4), 2. https://www.jasss.org/10/4/2.html
Models and methods
The governance model
PolicySwarm (Addala, 2026) runs 120 agents on a Barabási–Albert network (m = 3) with opinions in [−1,1]4, an ideology in [−1, 1], a fixed trust drawn from Beta(2, 2) and an influence weight proportional to their degree. Each of 60 ticks applies, in order, a policy tightening at tick 30, then scheduled shocks, which move a hub group or ten random agents toward the neutral centre, then a media pull scaled by ideology and trust. Next come 150 conversation attempts under the gate, with half blocked by the deployment cap and violators' influence halved after the enforcement lag, then the policy pull and, after the lag, a pull toward the perceived policy ai + τi(p + bi − ai) + η, where p is the policy, τi the agent's trust, bi its bias, ai the trust target and η noise of standard deviation 0.06. The Euclidean threshold is ε = 1.0 in centred coordinates.
The experiment compares paired runs with and without shocks, which share every other random stream, at enforcement lags of 0, 20 and 40 ticks. The relative shock effect is the change in final opinion variance divided by the variance of the run without shocks. The lag index is its mean at lag 40 as a percentage of its mean at lag 0. The interaction is cosine's change from lag 0 to lag 40 minus Euclidean's, paired by seed. The draft's index used the absolute shock effect. The switches restore the draft's choices: the gate measured from the cube's corner or its centre, the threshold shared or matched, the policy pull applied after a passing conversation or every tick, and four trust targets. A level-shift control moves every perceived policy by the corner's average shift, −(1 − τ̄). The recommended design uses a centred gate, a run-matched threshold and a pull every tick. Every cell has 100 paired seeds. Lag indices carry paired bootstrap 95% intervals and interactions 95% t intervals. An interaction counts as equivalent to zero when its 90% interval lies within ±0.01 (for the own-opinion target, [−0.003, +0.006]). I set that margin after an earlier version had reported the result it is used on, so that test confirms a result already known.
The minimal model
Agents hold opinions in [0,1]d or [−1,1]d on a fixed Erdős–Rényi graph with 500 nodes and mean degree 10. Each round draws a random matching of edges, evaluates the gate for every matched pair, and moves both agents of every pair that passes by μ = 0.3 toward each other, then clips to the cube. The graph and initial opinions come from one random stream and the matchings from another, so runs that share a seed differ only in the gate, the update step and ε.
The factorial crosses the opinion space (unit or centred cube), the dimension (d ∈ {2, 4, 8}) and a reference coverage (5%, 15%, 30%): 18 cells, 100 paired seeds each. Euclidean distance runs at the threshold giving the reference coverage at the start. Cosine and angular run under the shared, start-matched and run-matched rules, and an early-matched rule that matches the pass rate over the first 100 rounds only. Matched thresholds were found by bisection on 50 separate pilot seeds and checked on the evaluation seeds. The primary outcome is the number of opinion groups holding at least 1% of agents after 2,000 rounds, counted with one ruler for every geometry, with outcomes also recorded after 500, 1,000 and 4,000 rounds. A gap is equivalent to zero when its 90% interval lies within ±0.02 for the pass rate or ±0.25 on the log2 scale. Cosine and angular are reported separately in the paper and agree closely, so this page gives cosine.